Welcome to CARTE-AI documentation 📚!

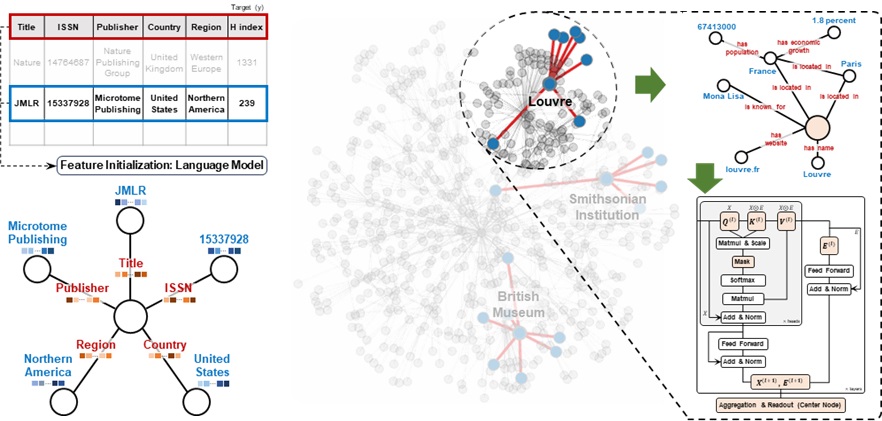
CARTE is a pretrained model for tabular data by treating each table row as a star graph and training a graph transformer on top of this representation.
Kim, M. J., Grinsztajn, L., Varoquaux, G. (2024). CARTE: pretraining and transfer for tabular learning. arXiv:2402.16785
Colab Examples (Give it a test):
- CARTERegressor on Wine Poland dataset
- CARTEClassifier on Spotify dataset
01 Install 🚀
The library has been tested on Linux, MacOSX, and Windows.
CARTE-AI can be installed from PyPI:
Installation
pip install CARTE-AI
Example of use of the library
import carte_ai
1️⃣ Load the Data 💽
  import pandas as pd
  from carte_ai.data.load_data import wina_pl

  num_train = 128  # Example: set the number of training groups/entities
  random_state = 1  # Set a random seed for reproducibility
  X_train, X_test, y_train, y_test = wina_pl(num_train, random_state)
  print("Wina Poland dataset:", X_train.shape, X_test.shape)

2️⃣ Convert Table 2 Graph 🪵
  import fasttext
  from huggingface_hub import hf_hub_download
  from carte_ai import Table2GraphTransformer

  model_path = hf_hub_download(repo_id="hi-paris/fastText", filename="cc.en.300.bin")

  preprocessor = Table2GraphTransformer(fasttext_model_path=model_path)

  # Fit and transform the training data
  X_train = preprocessor.fit_transform(X_train, y=y_train)

  # Transform the test data
  X_test = preprocessor.transform(X_test)

3️⃣ Make Predictions🔮
from carte_ai import CARTERegressor, CARTEClassifier

  # Define some parameters
  fixed_params = dict()
  fixed_params["num_model"] = 10 # 10 models for the bagging strategy
  fixed_params["disable_pbar"] = False # True if you want cleanness
  fixed_params["random_state"] = 0
  fixed_params["device"] = "cpu"
  fixed_params["n_jobs"] = 10
  fixed_params["pretrained_model_path"] = config_directory["pretrained_model"]

  # Define the estimator and run fit/predict
  estimator = CARTERegressor(**fixed_params) # CARTERegressor for Regression
  estimator.fit(X_train, y_train)
  y_pred = estimator.predict(X_test)

  # Obtain the r2 score on predictions
  score = r2_score(y_test, y_pred)
  print("\nThe R2 score for CARTE:", "{:.4f}".format(score))
